Once, at night, I could observe nice colours around the moon. There was a slight layer of clouds in front. I took a photograph.

It was like a rainbow but with less colours and less saturated and with the light source (the moon) at the origin of the phenomena in front of me. With a rainbow, the sun that provokes the 2 nice colourful half circles is behind you. The light close to the moon is « colder » (more blue) than the farther. The transition between blue and red is relatively sharp. Well, back to my home, I checked the name of this and I found that it is a « lunar corona » as well explained for example in the sites www.atoptics.co.uk and www.philiplaven.com . These sites explain that this irisation is due the diffraction of the moon light by water droplets that have quite all the same size. The typical size of the droplets is a mixture between 1 and 100µm. It appears that sometimes the size of the droplets is more uniform and it is when one can see the irisation around the moon. At this sizes we know that we can calculate the diffraction thanks to the so called Mie theory (Gustav Mie 1908) , a quite complex calculation to do without a computer.

For that, I made a java translation of the fortran code called BHMIE of the classical book : « Absorption and scattering of light by small particles / Craig F. Bohren, Donald R. Huffman. ». I take wavelength form 380 to 780nm, the ones usually used for colour spectroscopy. (Figure 3 )


Again, the left spectrum clearly shows more energy at short wavelength (blue) than the right one. The next step is to transform the spectra into colour eye stimulus. For that, I advise to report to the previous post which is about this topic. The spectrum curve is « projected » into 3 coordinates X, Y and Z thanks to the curves of eye response x, y and z provided by the CIE. Then these coordinates are transformed into the R,G and B codes, adequate to colour encoding for our computer display. See Figure 5. The red curve is saturated since the parameter “luminosity” has been set to 5.

Nice. The last step is now to build a synthetic image of the moon and the diffracted light around. We just have to print the moon circle of 30” diameter (half a degree or 0.0087 rad) and choose the colour of the pixels around according to the previous curves.

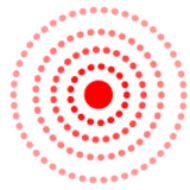
The next figure shows 3 synthetic images covering the angular range +/- 3° , which is more or less the angular range of the photograph, for the case of 3 water droplet sizes (10, 15 and 20µm) and the real photo. Increasing the size of the droplet decreases the halo’s one.

One can see the unsaturated coloured circles around a bright blue/white centre. It looks like that at the moment of the photo the droplet size was quite close to 15µm. Software: You can download the software here the following material: application jar file to be executed directly , applet (java>1.6).